Wardrobe Analytics
The analytics page gives you a data view of your wardrobe activity: how much of your wardrobe you actually use, how often you accept suggestions, and which items get the most (and least) attention.
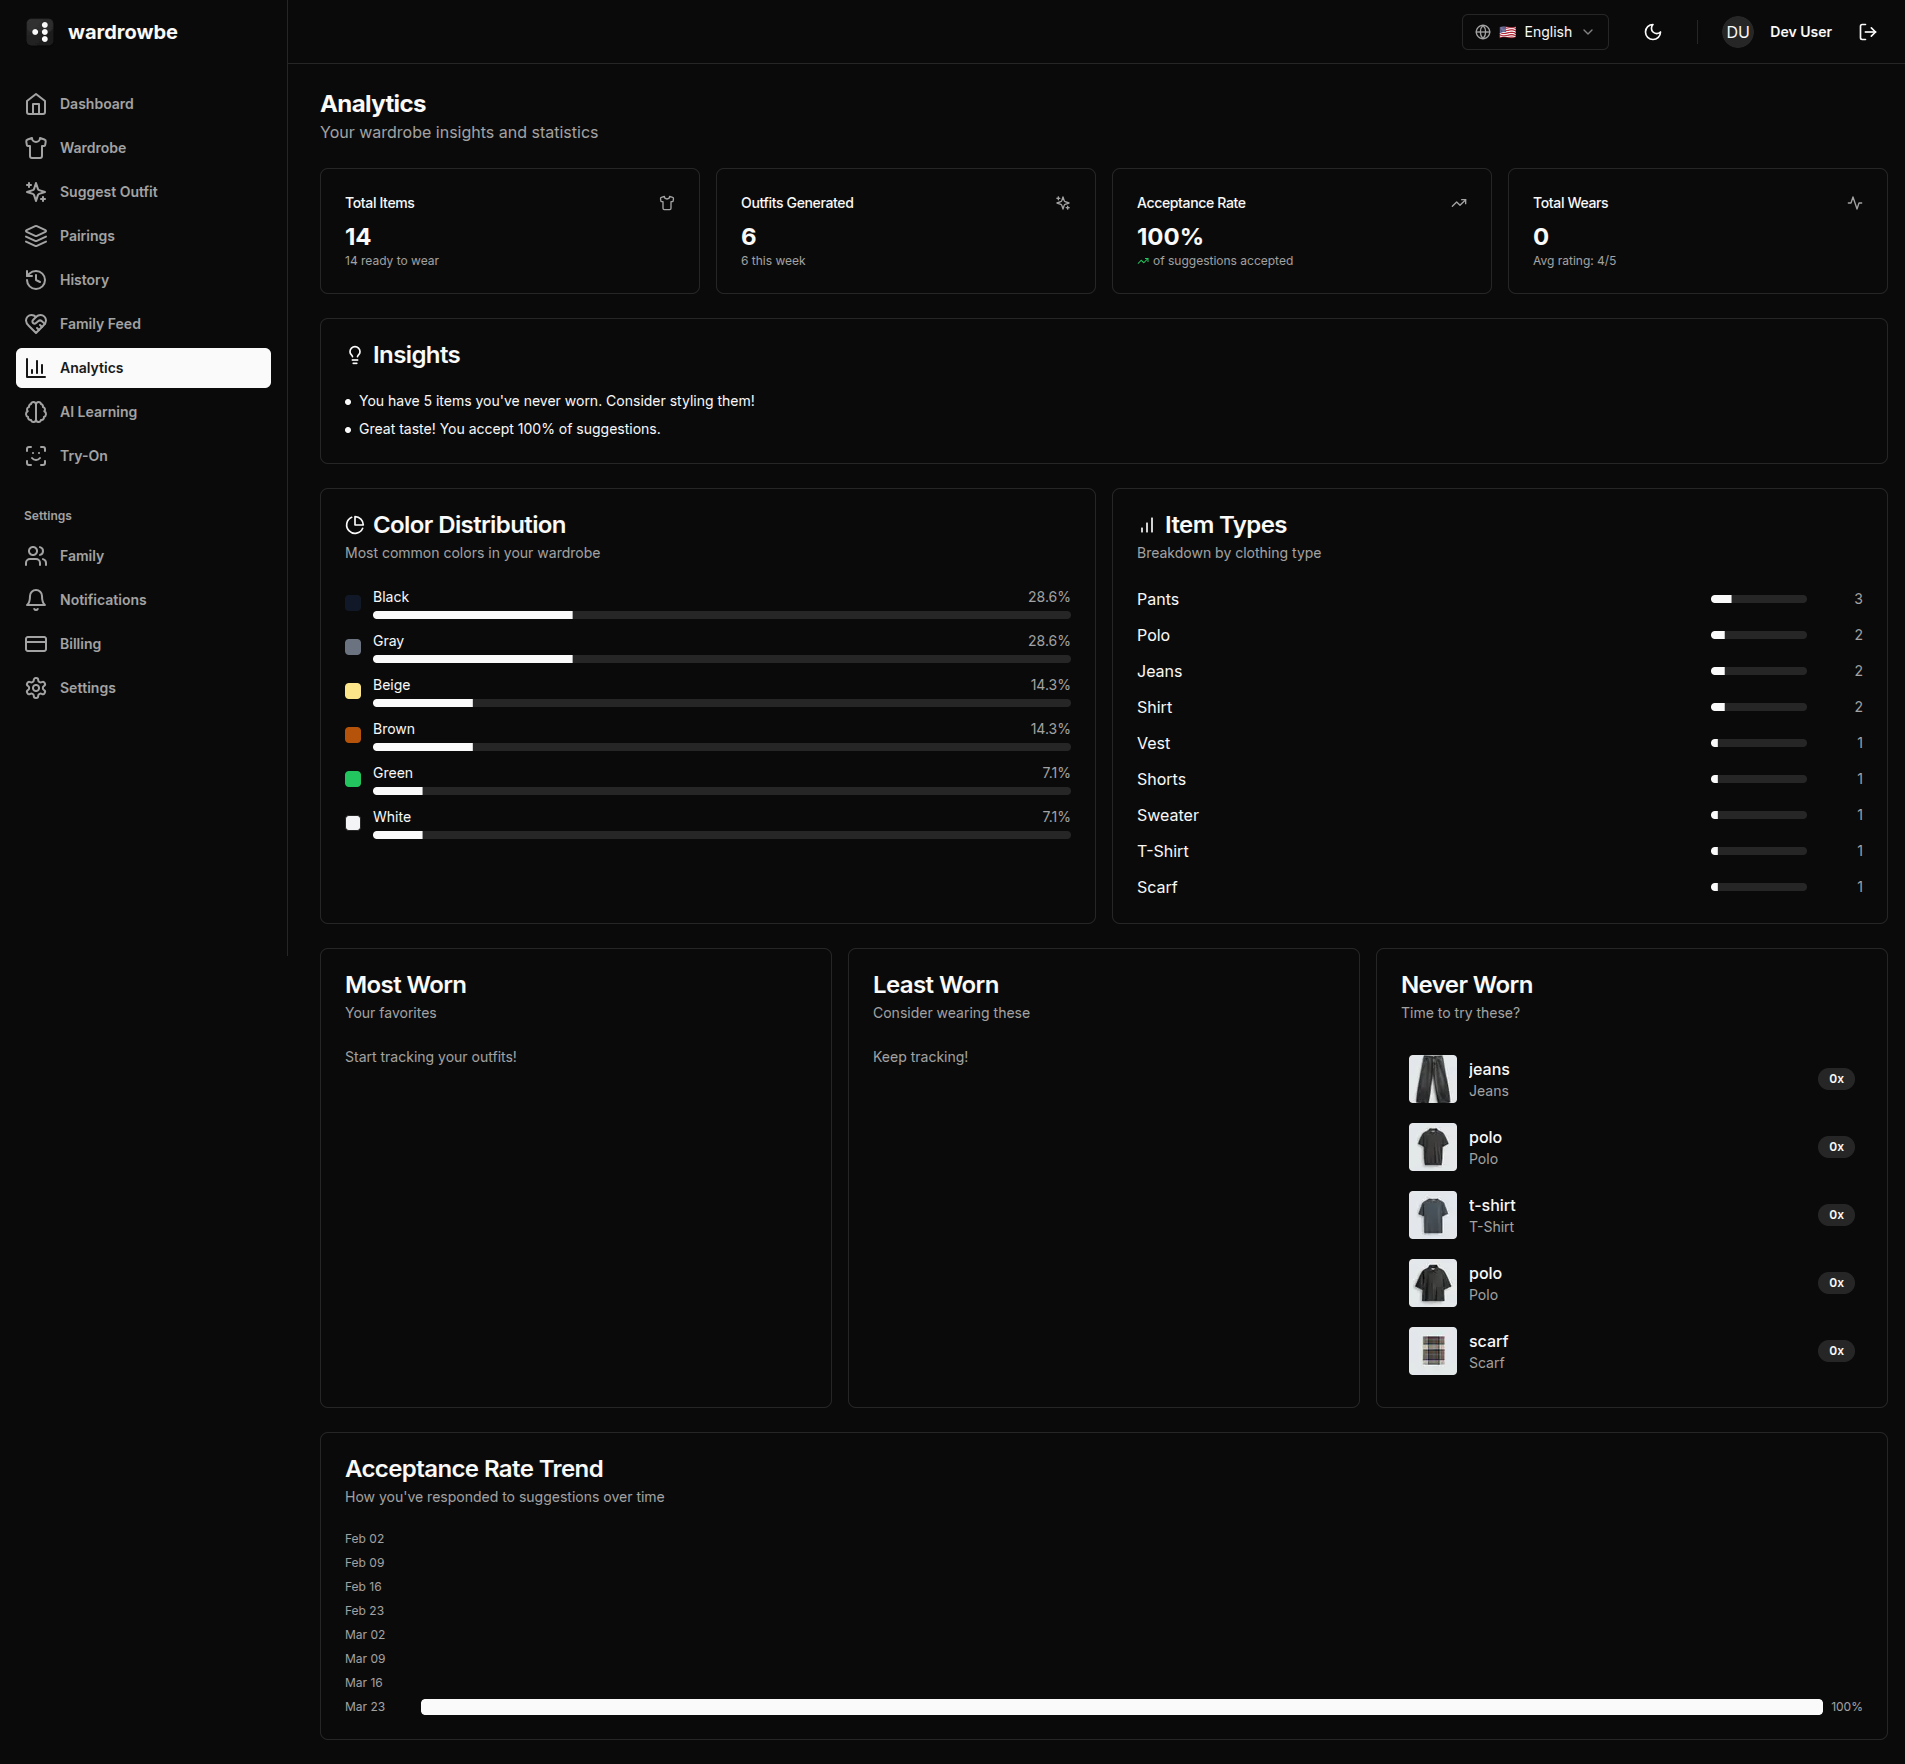
Stat Cards
Four summary cards at the top give you the headline numbers.

| Card | Description |
|---|---|
| Total items | Number of active items in your wardrobe (excludes archived) |
| Outfits generated | Total suggestion count across all time |
| Acceptance rate | Percentage of suggestions you accepted, with a trend indicator showing whether it’s improving or declining |
| Total wears | Sum of all wear logs across all items |
The acceptance rate trend shows the direction over the past 30 days compared to the 30 days before that. An improving trend means the AI is learning your preferences.
Charts
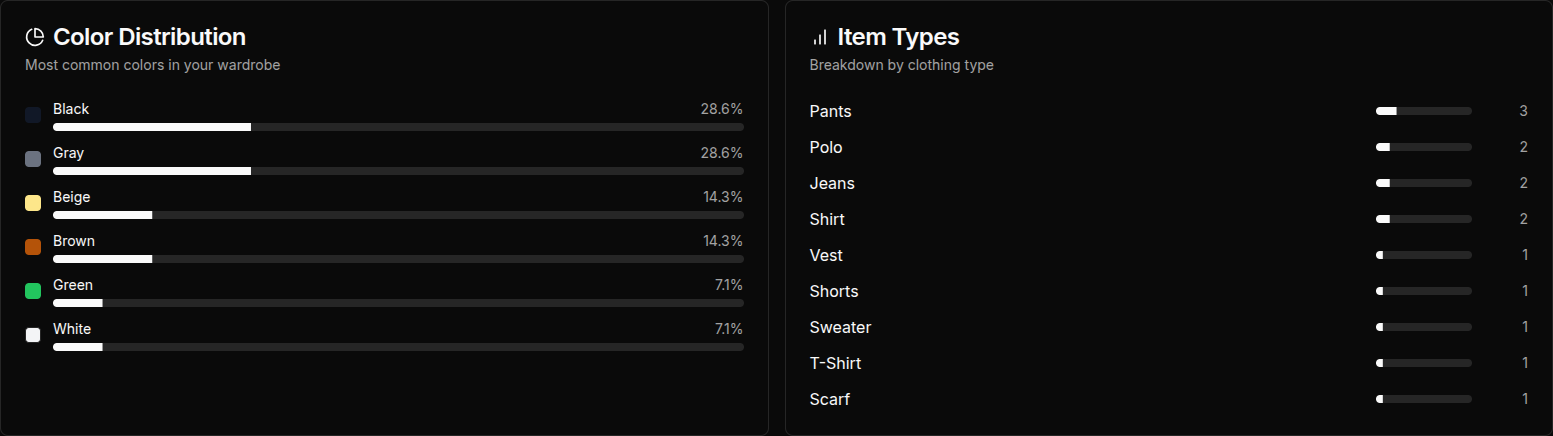
Color distribution: A breakdown of the colors in your wardrobe by item count. Useful for seeing whether you have a balanced palette or are heavily concentrated in one color.
Item types: How your wardrobe is distributed across clothing categories (tops, bottoms, outerwear, shoes, accessories). This helps identify gaps (e.g., you have 20 tops but 3 pairs of trousers).
Acceptance trend: A line chart showing your acceptance rate over the past 90 days. Dips and peaks often correspond to seasonal wardrobe changes or preference setting adjustments.
Most Worn Items
A ranked list of your most-worn items by wear count. These are the workhorses of your wardrobe.
Least Worn Items
Items in your wardrobe with a low wear count relative to how long they’ve been added. This helps identify items that might need to be archived or given away.
Never Worn Items
Items that have zero wear logs. These are candidates for review: either add them to outfit rotations or consider archiving them.
AI Insights
At the top of the analytics page, an AI-generated insights section summarizes patterns in your data. Examples:
- “You’ve worn 68% of your wardrobe in the past 90 days, which is above average.”
- “Your acceptance rate has improved 12% since you updated your style preferences.”
- “3 items have never been worn despite being added over 60 days ago.”
Insights are updated periodically as your data grows.
Mobile: Analytics is available in the Settings tab on mobile under “Analytics.” The layout stacks the charts vertically for smaller screens.